
Revenue that swings wildly from quarter to quarter. A pipeline that looks full but doesn’t close. Forecasts nobody quite believes. Marketing, sales and customer success each pointing at their own dashboard. Sound familiar? Most B2B companies hit these walls at some point, and the cause is usually the same: they’re not measuring the right things, or they’re measuring them in silos.
Revenue operations KPIs fix that by giving every team one shared view of performance. If you’d like help building that view, Revenue Operations Consulting can set it up with you.
What Are Revenue Operations KPIs and Why Do They Matter?
Revenue operations KPIs are the metrics that measure how well your whole revenue engine works, from first lead to renewal. Unlike team-level numbers, RevOps KPIs connect marketing, sales and customer success. That’s what makes them powerful.
Here’s the thing: they’re also how you get honest revenue forecasting, real pipeline visibility and sustainable growth. Without them, you’re steering by feel. For the bigger picture, read the benefits of revenue operations consulting.
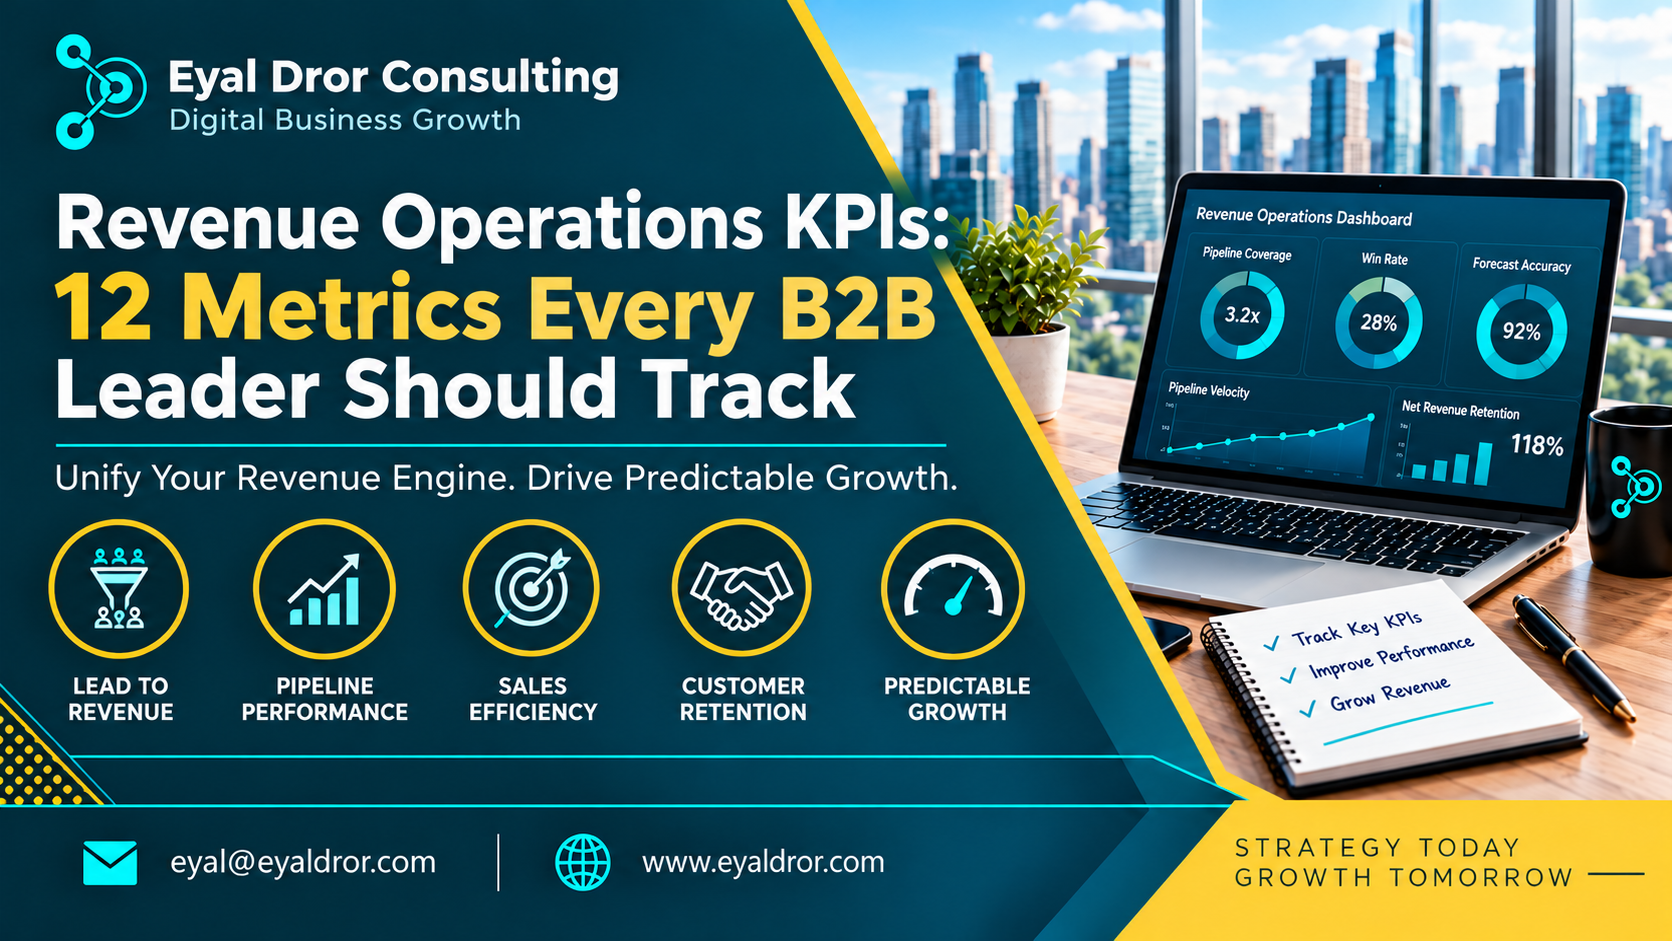
12 Essential Revenue Operations KPIs Every B2B Leader Should Track
For each metric, you’ll get what it measures, the formula, why it matters and how to improve it. Treat benchmarks with caution. The right numbers depend on your segment, deal size and sales motion.
1. Marketing Qualified Lead to Sales Qualified Lead Conversion Rate (MQL-to-SQL)
Formula: SQLs ÷ MQLs × 100. It indicates how many of the leads generated through marketing that sales considers worthwhile. A lower percentage is an indicator of poor lead generation or mismatched definition. Improving it involves having an agreed upon criteria for lead qualification.
2. Lead-to-Opportunity Conversion Rate
Formula: Opportunities ÷ leads × 100. This sales conversion rate shows how well leads become real deals. Tighten targeting, speed up follow-up and fix funnel leaks. Our Sales Funnel Optimization service focuses on exactly this.
3. Sales Pipeline Velocity
Formula: (Opportunities × average deal value × win rate) ÷ sales cycle length. Pipeline velocity shows how quickly revenue moves through the pipeline. Raise any of the first three inputs, or shorten the cycle, and velocity improves.
4. Average Sales Cycle Length
Formula: Total days to close won deals ÷ number of won deals. Longer cycles delay revenue and strain cash. Remove approval delays and stalled stages to shorten it.
5. Opportunity Win Rate
Formula: Won deals ÷ (won + lost deals) × 100. It reveals how effective your selling is once a deal is real. Analyze your wins and losses and position yourself better than the competition.
6. Sales Pipeline Coverage Ratio
Formula: Open pipeline value ÷ revenue target. It shows whether you have enough pipeline to hit your goal. Too little means a miss is coming. Build pipeline earlier, and Revenue Operations Consulting can help you model how much coverage you actually need.
7. Revenue Forecast Accuracy
Formula: Actual revenue ÷ forecast revenue × 100, tracked over time. The reliability of revenue forecasting accuracy will tell you if the leaders have confidence in the numbers. This metric can be improved through clean close dates, clear definition of stages, and forecast reviews.
8. Customer Acquisition Cost (CAC)
Formula: Total sales and marketing spend ÷ new customers acquired. Customer acquisition cost shows what winning a customer costs. Reduce it by cutting wasted spend and improving conversion.
9. Customer Lifetime Value (CLV)
Formula (simple): Average revenue per customer × gross margin × expected customer lifespan. Customer lifetime value shows what a customer is worth over time. Raise it through retention, upsell and better-fit customers.
10. CAC Payback Period
Formula: CAC ÷ (monthly recurring revenue per customer × gross margin). It tells you how many months it takes to earn back acquisition cost. Shorter is healthier for cash. Lower CAC or raise early revenue.
11. Net Revenue Retention (NRR)
Formula: (Starting recurring revenue + expansion − contraction − churn) ÷ starting recurring revenue × 100. Net Revenue Retention reflects growth from your current customer base. You can increase revenue retention through improved onboarding, expansion plays, and proactive customer success.
12. Customer Churn Rate
Formula: Customers lost during a period ÷ customers at the start × 100. Churn is the quiet leak. Find the reasons customers leave and fix them early.
How to Track and Measure Revenue Operations KPIs Effectively
Knowing the metrics is half the job. The other half is making them usable.
Set Clear Revenue Goals and KPI Targets
Tie each KPI to a revenue objective. If the goal is faster growth, pick the metrics that drive it, and set realistic targets based on your own history, not generic benchmarks.
Use CRM and Revenue Analytics Dashboards
A revenue operations dashboard brings your numbers into one place. Make sure CRM data is accurate, fields are completed and tools are integrated, so every team reads from the same source. What most people miss is that a beautiful dashboard built on messy data is just a confident-looking mistake.
Review KPI Performance and Identify Improvement Opportunities
Review regularly. A steady rhythm exposes pipeline bottlenecks, forecasting gaps and inefficient processes before they hurt revenue. If you want an outside view, Revenue Operations Consulting can run that review with you.
Common Mistakes to Avoid When Tracking Revenue Operations KPIs
- Tracking too many KPIs. Without clear priorities, you drown in numbers.
- Using inaccurate or incomplete CRM data. Bad inputs mean bad conclusions.
- Focusing only on sales metrics. Ignoring retention hides half the story.
- Setting unrealistic benchmarks. They demotivate teams and distort decisions.
- Failing to act on the data. A metric nobody responds to is decoration.
If several of these sound familiar, read the signs your business needs revenue operations consulting.
Frequently Asked Questions
What are the most important revenue operations KPIs?
It depends on your stage, but win rate, pipeline coverage, forecast accuracy, CAC, NRR and churn give a strong core view of acquisition, efficiency and retention.
How do B2B companies measure revenue operations performance?
By tracking a consistent set of revenue performance metrics across the whole funnel, from lead conversion to retention, in a shared dashboard fed by clean CRM data.
What is the difference between sales KPIs and RevOps KPIs?
Sales KPIs are targeted at the sales teams, for example, win rate and cycle time. RevOps KPIs are for marketing, sales, and customer success, connecting acquisition to retention and growth.
How often should businesses review revenue operations metrics?
Most teams review pipeline metrics weekly or monthly and financial metrics such as CAC and NRR monthly or quarterly. Match the rhythm to your sales cycle.
Conclusion
Tracking the right revenue operations KPIs makes revenue more predictable, sales more efficient and retention stronger. Start with a handful, get the data clean and act on what you see.
If you’d like support, explore Revenue Operations Consulting or our Growth Strategy Consulting to turn these metrics into a plan.
