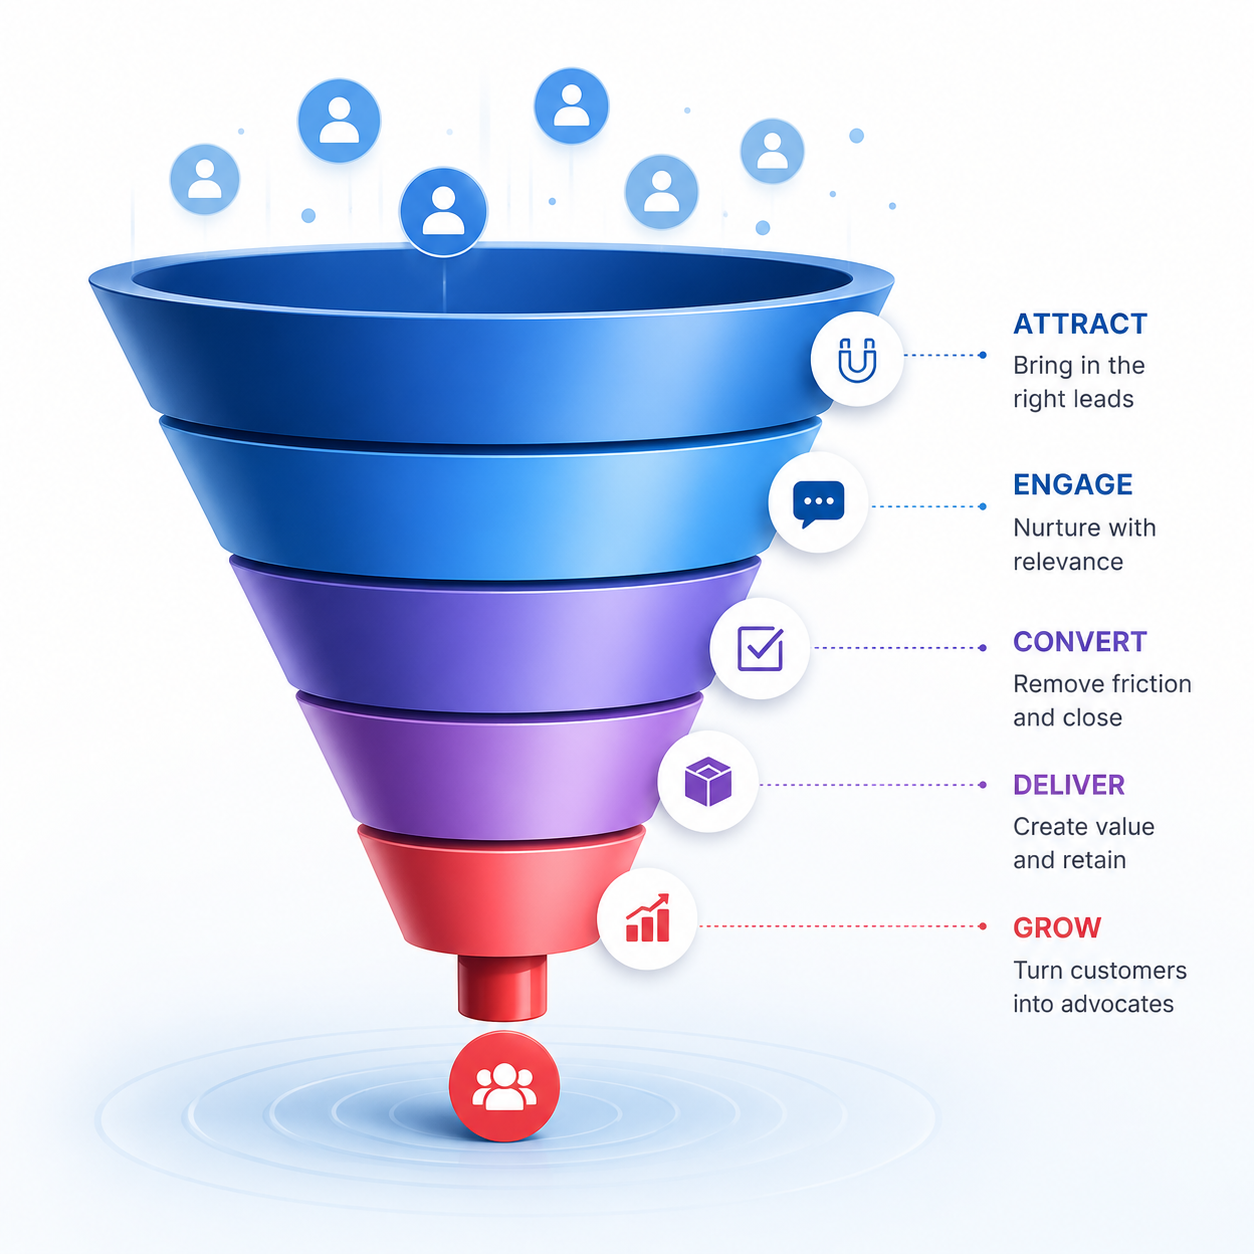
This case study demonstrates the impact of data-driven funnels to boost e-commerce (47% higher) and ROAS (156% higher) in 90 days using a combination of systematic measurement, audience segmentation, creative testing, and automated decisioning.
Introduction
We partnered with a mid-market online store in the home decor category with an average order value of $85 and a 1.8% baseline conversion rate. The cost of acquiring customers was increasing and the profitability and growth strategies were in danger as the ratio of profit on ad spend remained at or below 2:1.
It is a complete case study that provides our precise methodology, tools, experiments, and outcomes. You will observe the very methods by which we changed their funnel system of performance systematically.
Are you prepared to implement these strategies? Due to specific challenges, schedule a 30-minute free audit call to get help or download our full playbook on funnel optimization.
Executive Summary
90 days later, we optimizedthe funnel and funnel conversion rate went up to 2.65% (was 1.8) and ROAS went up to 4.85:1 (was 1.9:1).
Before and After Results
| Metric | Before | After | Change |
| Monthly Traffic | 45,000 | 68,000 | +51% |
| Conversion Rate | 1.8% | 2.65% | +47% |
| Average Order Value | $85 | $103 | +21% |
| Customer Acquisition Cost | $42 | $28 | -33% |
| Return on Ad Spend | 1.9:1 | 4.85:1 | +156% |
| 90-Day Customer LTV | $127 | $189 | +49% |
These upgrades brought in an extra $340,000 in revenue within the 90 days and the marketing expenditures were cut by 18% due to enhanced efficiency.
The Challenge
Our client was a premium home decor client that had good brand positioning and poor online performance. Their middle-income customer segment of $85 order value necessitated effective customer acquisition to gain sustainable growth.
Key Problems Identified: Product page abandonment was high, with 68% of visitors not making purchases upon entering the cart. The cart abandonment rate was more than 72 percent, which is significantly higher than the industry rates of 65-70 percent.
Poor performance of the ads was caused by a creative-to-audience mismatch, with less than 1.2% of click-through and high cost-per-click. The fragmentation of analytics on various platforms could not enable the decision of clear attribution and optimization.
Long payback periods represented that the cost of acquiring customers was not recovered until month three and this created a cash crunch and constrained marketing investment capacity.
Impact on Business: The growth in revenues leveled off to 5 percent annually even as the company upgraded its spending on advertising. The limitations in investing in inventory and developing new products were due to cash flow limitations. It could not scale because of unprofitable customer acquisition.
Our Approach: Data-Driven Funnel Framework
We employed a 4-layer funnel: Acquisition, Activation, Monetization, Retention-they were supported by data, experiments, and automation.
1) Audit and Measurement Foundation
We consolidated data between Google Search Console, Google Analytics 4, Google Tag Manager, advertising platforms, CRM system and customer data platform. These coherent perceptions facilitated proper attribution and funneling analysis among touchpoints.
Event Model Implementation: Defined canonical events including view_item, add_to_cart, begin_checkout, purchase, and subscription_start. Each event captured the necessary parameters for detailed analysis: product ID, price, quantity, and category.
Developed UTM taxonomy that allows uniform tracking of a campaign used on all channels. Implemented deduplication policies that inhibit the counting of conversions made on several touchpoints.
Enacted reconciliation procedures between ad spend reports and revenue information every week. This established lapses in tracking and attribution differences that needed corrections.
Deliverables: Measurement plan document, event naming spreadsheet, tracking implementation guide with the team making sure they are on data standards.
2) Audience Segmentation and Predictive Scoring
We divided the audiences depending on behavioral intent, buy history and propensity for lifetime value. There were five main segments that were identified: first-time visitors, returning browsers, high-intent viewers (3+ products), cart abandoners and past purchasers.
Used lookalike modeling to grow effective customer profiles to new customers. Conversion likelihood and potential value: Propensity scoring based on customer data platform ranked leads.
Scoring Thresholds: High-value prospects: 70% or more conversion probability, $120 or more predicted LTV Medium-value prospects: 40-70% conversion probability, 80-120 predicted LTV Low-value prospects: Less than 40% conversion probability or 80 predicted LTV
Deliverables: Definitions of the audience segments, documentation of the scoring model, and recommendations on how the segment should be targeted.
3) Creative and Offer Experiments
Ran multivariate and A/B tests on hero headlines, product imagery, call-to-action buttons, price framing, and urgency messaging. Every aspect was tested separately and not a combination with several variables.
Ad Creative Matrix: Evaluated 6 creative options on three audience groups with two landing page options. A combination of 36 tests with the best creative-audience-landing-page combinations.
Imagery Themes, Lifestyle vs product shots, benefit vs feature messages and Urgency vs Value copy themes.
Deliverables: Creative test spreadsheet of all variations, performance data, sample creative files, and optimization suggestions.
4) Funnel Optimization and Personalization
Installed custom landing pages, URL templates and automatic content placement. Depending on the traffic source and segment, visitors were shown various headlines, product recommendations and social proof.
Triggered Automation Flows: Cart abandonment sequence (3 emails in 24 hours), recovering 15 percent of abandoned carts. Browse abandonment messages should be sent to active visitors over 48 hours who failed to add products.
A combination of cross-sell sequence recommendation of complementary products in 7 days. Win-back series is aimed at customers who have not made purchases during the last 60 days with special offers.
Deliverables: Flow diagrams depicting trigger logic, email and SMS templates used in each sequence, and performance benchmarks.
5) Automated Decisioning and Scaling
Determined regulations up-scaling winning combinations with statistical significance levels. Before major budget increases, a minimum of 100 conversions and 95% confidence was needed.
Robotic budget reallocation that channels the expenditure of the ineffective campaigns to the winners each night. This optimization was much faster than it would have possible manually managed.
Scaling Guardrails: Frequencies that keep the audience so repeatedly interested that it gets tired of being impressed. Creative refresh frequency with new variants introduced every 14 days to keep the interest alive.
Budget increase caps limit the daily spend growth to 25 per cent to avoid loss of efficiency due to scaling fast.
Deliverables: Scaling playbook document, automation rule settings, and monitoring dashboard automated decisions.
Tools and Technology Stack
Takeaway: The analytics, advertising platforms, customer data platform, and automation tools were connected in a seamless manner using a lean stack.
Analytics: Google Analytics 4 to track the behavior and BigQuery to store the raw data and perform custom analysis to allow advanced reporting.
Tagging: Google Tag Manager server-side tagging and client-side reduction of tagging will reduce the client-side load and enhance the accuracy of the data due to controlled processing.
Customer Data Platform: Channel Customer segmentation and activation via real-time segmentation updates.
Experimentation: Optimizely to do landing page tests and A/B testing native advertising platform to creative variations.
Email/SMS Automation: Klaviyo Triggered sequences with revenue attribution and segmentation-based personalization.
Advertising Platforms: Meta (Facebook/Instagram), Google Ads and Pinterest in order to have a multichannel reach and testing.
Business Intelligence: Looker Studio is creating single dashboards that combine information from various sources with automated scheduled reports.
Step-by-Step 30/60/90 Day Playbook
Run structured test calendar: Phase 1 (stabilize measurement), Phase 2 (test and learn), Phase 3 (scale and optimize retention).
Days 1-30: Measurement and Baseline
The application of the full event track model corrected any gaps in data that were identified during the audit stage. Google Analytics 4 with custom events and enhanced e-commerce tracking.
Introduced initial creative tests among three pieces of advertising with three sets of audience. Operating standards of future optimization decisions.
Constructed an easy cart abandonment email flow as a quick win that creates an instant revenue lift. This was worth the initiated automation strategy.
Days 31-60: Iterate and Expand
Individualized landing pages depending on customer preference and source of traffic. Such product suggestions were dynamically changed in accordance with the history of browsing and the segmentation features.
Introduced intensive retention processes such as browse abandonment, post-purchase series, and customer reactivation programs. These self-service touchpoints boosted repurchasing.
Created an audience scoring model with real conversion and LTV data within the first 30 days. Launched lookalike audience campaigns on high-propensity prospects.
Days 61-90: Scale and Governance
Winning creative and audience combinations are growing 50-100 percent, with targets keeping efficiency measures. Daily performance is being monitored and easily adapted to the changes.
Installed an auto budgetary allocation that diverted expenditure to non-performing campaigns to those performing well. The optimization was performed automatically.
Implemented LTV based bidding based on predicted customer value as compared to first-purchase value. This facilitated the acquisition of highly valuable customer segments more aggressively.
Establish frequent quality assurance strategies such as weekly data balances, monthly creative overhauls and quarterly strategy assessments to maintain momentum.
Example Experiments and Results
Experiment 1: Hero Headline Testing
Hypothesis: The benefit-based headlines will be better by 20 percent or higher than the feature-based headlines in conversion rate.
Test Design: The tests were created with three variations of headlines appearing on product pages. The distribution was equal to divide the traffic. Conducted as a 12,000-visit variation over 14 days.
Finding: Benefit-oriented headline has improved the conversion rate by 33 percent, that is, 1.8 percent to 2.4 percent. The cost per acquisition reduced by 22 percent and retained the order value.
Insight: Customers were more receptive to outcome-driven messages than product specifications. This was the applied learning of all marketing creatives.
Experiment 2: Cart Abandonment Sequence
Hypothesis: Three-email cart abandonment sequence will retrieve 12-15 per cent. abandoned carts in 24 hours.
Test Design: Automated sequence of mailing of emails at 1 hour, 6 hours, and 18 hours after abandonment and increasing incentives.
Output: Retrieved 15.3% of the abandoned carts, which translated to an extra 18,400 revenue per month. Recovery order value was, on average, above the standard purchases by 8 per cent.
Learning: Email 1 led to 60 per cent higher recovery rates when urgency texting was used. Follow-up emails on offers attracted further conversions.
Experiment 3: Audience Segmentation
Hypothesis: High-intent group (watched 3 or more products) will convert 3 times more compared to broad audiences, justifying high bid strategies.
Test Design: Developed special campaigns on the high-intent segment at 50 percent higher bids than broad targeting.
Findings: Conversion rate in the high-intent segment was 4.2x higher than in broad audiences, with 45% lower cost per acquisition, even at higher bids.
Learning: There was an accurate prediction of conversion based on behavioral cues. Wider segmentation plan for other behavioral stimuli.
KPI Dashboard and Reporting
We monitored the performance daily using a single dashboard that incorporated all data. This real-time view led to prompt optimization decisions.
Daily Ad Performance Metrics: Spend, impressions, clicks, click-through rate, cost per click and cost per thousand impressions per campaign and platform.
Funnel Conversion Metrics: View-to-add-to-cart rate (32% versus 18% achieved versus baseline), add-to-cart-to-checkout rate (42% versus 28% achieved versus baseline), checkout-to-purchase rate (78% versus 65% achieved versus baseline).
Business KPIs: ROA spend, customer life time value after ninety days and thirty, repeat purchase, and the frequency of average order.
Alerting Rules: A drop in conversion rates of greater than 15 percent per day generated an instant assessment. The cost per acquisition is more than 20% required audit in the campaign.
Hourly dashboard update of the actual performance versus targets. Executive summaries each week covered the most important trends and optimization opportunities.
Risks, Mitigations and Governance
Data Discrepancy Risk: Platform reporting differences resulted in confusion about actual performance. Mitigation: The mitigation strategy was to have weekly reconciliation between ad spend and revenue in the sources.
Audience Fatigue Risk: Recurring ads declined the level of engagement and became more expensive in the long term. Mitigation: Put in place a creative rotation schedule and frequency limits restricting impressions.
Short-Term Optimization Risk: The short-term optimization strategy prioritized short-term returns at the expense of the long-term customer value. Mitigation: Preference for weighted decisions to LTV instead of first-purchase measures.
Governance Framework: Strategy, execution and analysis have clear roles. Frequent team meetings assessed the work progress and validated optimization strategies.
The monthly executive reviews measured progress towards the goals and the adjustment of strategies. Tracking accuracy was checked quarterly and the improvement opportunities were identified.
Pricing, Scope and Engagement Model
We provide explicit career paths: Audit, Pilot (30-90 days), or Managed Service, based on your level of growth.
Initial Audit ($2,500-5,000): When it comes to funnel analysis, the top 10 quick wins are. The expected deliverables are a measurement plan, opportunity prioritization, and a roadmap of action within 30 days.
90-Day Pilot Program ($15,000-25,000): Data infrastructure implementation, testing framework and optimization processes. Concurred on KPI with monthly playbook documentation and reviews.
Ongoing Managed Service (Starting at $8,000/month): Continuous optimization, testing and scaling with performance bonus options aligning incentives. Involves periodic reporting, strategic direction and full service implementation.
Sample deliverables per phase: Tracking implementation, audience segmentation, creative testing program, and automation flows, scaling playbook, and monthly performance reporting.
Frequently Asked Questions
What is a data-driven funnel approach?Â
Data funnels involve measurement, segmentation, testing, and automation to streamline every step of the process of awareness through retention.
How quickly can we expect measurable results?Â
Quick wins usually result in initial improvements that are normally experienced in 30 days. Large-scale performance changes take 60-90 days to test and optimize.
Which KPIs matter most for e-commerce funnels?Â
Instead of vanity metrics, concentrate on conversion rate, customer acquisition cost, goodwill on ad spend, and customer lifetime value.
Do you integrate with our existing analytics stack?Â
Yes, we have integrated with such major platforms as Google Analytics, Shopify, Meta, and the majority of customer data platforms that guarantee smooth integration.
What budget is needed for effective testing?Â
At least $3,000-5,000 in ad spend per month would allow testing to be statistically relevant. Greater budgets hasten the learning and scaling prospects.
How do you handle attribution across multiple touchpoints?Â
We apply multi-touch attribution models and apply incrementality testing that proves the actual effect as opposed to using a last-click attribution.
Can you work with our in-house team?Â
Absolutely. We provide joint work trainings of the internal teams and can make a strategy or complete management choices according to your choice.
What if our current performance is already strong?Â
When you are getting great results but could use more or more efficient funnel stages, one of the options is to enlist the services of experts who will be able to recognise even greater optimization opportunities and install complex testing structures that can take the performance to a new level without jeopardising the existing performance.
Conclusion
This case study illustrates the ability to provide quantifiable business outcomes through systematic and data-driven funnels to boost e-commerce. The improvement of 47 percent conversion and 156 percent ROAS was due to the disciplined execution of the measurement, segmentation, testing, and automation.Â
The methodology applies across e-commerce categories and business sizes. Start with proper measurement, identify high-impact opportunities through data analysis, test systematically, and scale winners while maintaining efficiency. Whether you’re struggling with low conversion rates, high acquisition costs, or inefficient ad spend, Eyal Dror Consulting can help you transform your funnel performance systematically with these proven strategies.


Leave a Comment